3D connectivity calculation method for low-dip fractures in high-steep rock slopes
3D connectivity calculation method for low-dip fractures in high-steeprock slopes

Abstract:
Low-dip fractures are one of the main fracture sets controlling the stability of high-steep rock slopes and directly affect the anti-sliding stability of arch dam abutments.The spatial complexity and randomness of fractures in rock masses pose challenges to the accurate determination of 3D connectivity.This paper proposes a new method for calculating 3D connectivity. By correcting the sampling bias caused by the angle between fractures and the measurement window, a copula-based bivariate distribution model is used to model fracture orientation, and a 3D discrete fracture network (DFN) model that accurately reflects the spatial distribution of fractures is constructed.The optimal path search algorithm (A* algorithm) is used to identify potential failure paths on different sections of the DFN model, and discrete interpolation analysis is used to predict potential 3D shear surfaces at different elevations. Then, Boolean operations are used to project the fractures involved in penetration failure onto the 3D surface, ultimately obtaining the 3D connectivity that reflects the failure mode of the engineering rock mass.The method was applied to evaluate the connectivity of low-dip fractures in the abutment rock mass of a hydropower project in Tibet. Numerical simulation results verified the accuracy of the method. In addition, through comparative analysis with traditional 2D methods, the reliability of the proposed 3D connectivity calculation method was further verified. This paper provides a reference for the anti-sliding stability of abutment rock masses in hydropower projects and the selection of foundation surfaces, and offers new insights into the 3D connectivity characteristics of rock mass fractures.
Introduction:
Fractures, also known as joints, are planes along which rock locally loses cohesion due to stress, usually without significant displacement of the rock on either side. Randomly distributed fractures play a crucial role in controlling the fundamental mechanical behavior and overall stability of rock masses.They not only affect the strength of the rock mass but also serve as potential geometric and mechanical boundaries for engineering instability. In practical engineering, the shear strength problem of rock masses often involves the combined shear strength of joints and rock bridges, which largely depends on the accurate calculation of fracture connectivity along potential failure surfaces. Especially in the stability analysis of high-steep rock slopes, the connectivity characteristics of low-dip fractures play a key role in evaluating the anti-sliding stability of abutment rock masses.
Low-dip fractures are one of the main structural planes constituting slope movement, and their connectivity directly affects the overall strength and stability of the rock mass.However, due to the spatial complexity and randomness of fracture development in rock masses, previous researchers have found that accurately quantifying fracture connectivity is a challenge. They conservatively estimated the strength of rock masses by assuming that fractures have fully penetrated. Although this method is simple and feasible, it severely underestimates the strength of the rock mass. To improve the utilization of rock masses, the concept of 2D fracture connectivity was proposed.
Researchers initially defined the 2D connectivity rate as the average trace length of measured fractures equal to the sum of the lengths of penetrating paths (the average trace length of fractures plus the average length of rock bridges).However, due to the limitation of the size of field measurement windows, it is extremely difficult to obtain the true trace lengths of fractures and the spacing between rock bridges. The window estimation model(H-H method),Wuet al.estimated connectivity based on the proportions of visible, partially visible, and invisible fracture traces within the measurement window, significantly solving the problem of joint spacing estimation. In addition, the bandwidth projection method was proposed to calculate connectivity and obtain the development characteristics of fractures in the shear direction. The bandwidth projection method assumes that rock masses generally do not fail along a single fracture but are controlled by multiple fractures distributed within a specific bandwidth. Therefore, the 2D connectivity rate can be defined as the ratio of the sum of the projected lengths of all fractures within a specified bandwidth on the assumed projection baseline to the length of the projection baseline. Determining the bandwidth for projection calculation in rock masses that have not yet failed remains a challenge. Although both the H-H method and the bandwidth projection method are simple and superior, their applicability in 3D analysis and calculation is limited because they do not consider the 3D spatial characteristics of fractures.
According to the definition of 2D connectivity, 3D connectivity refers to the ratio of the projected area of fractures on a reference plane to the area of the reference plane.However, current techniques still cannot accurately characterize the complex 3D morphology of fracture surfaces. To obtain the spatial distribution characteristics of fractures, various field investigation techniques such as geophysical prospecting, 3D laser scanning, UAV photogrammetry, and image analysis are used to acquire fracture information. However, these techniques only capture the morphology of some large developed fractures on shallow surfaces, and the accuracy of the obtained connectivity rates has always been controversial. The FERM (Forensic Excavation of Rock Mass) method was proposed to reconstruct the 3D morphology of fractures by injecting expandable chemical agents into the rock mass, thereby obtaining 3D connectivity rates. This method can obtain true and effective fracture connectivity characteristics, but it is costly and not suitable for large-scale deep rock mass fractures. Over the past half century, statistical-based discrete fracture network (DFN) modeling methods have gradually become the mainstream approach for obtaining 3D connectivity characteristics of fractures. Priestet al.first proposed using computer programs to generate discontinuous fractures represented digitally or graphically, which were subsequently widely applied in geotechnical engineering. Numerous case studies have shown that the geometric parameters of fractures in rock masses (such as shape, orientation, trace length, and density) often follow certain probability distribution characteristics. Monte Carlo fracture network simulation can predict and simulate uncertain fractures based on the distribution patterns of measured parameters, and solve the problem of constructing realistic fracture network diagrams by increasing the number of simulations. Therefore, determining the geometric distribution characteristics of fractures is crucial for establishing 3D DFN models. Many scholars have studied the geometric shapes of fractures, assuming that fracture geometry in DFN models can be represented as thin disks or quadrilaterals with fixed aspect ratios. Regarding fracture orientation characterization, Fisher introduced the bivariate Fisher distribution based on rotational symmetry around the mean orientation. This distribution contains only one concentration parameter and is integrable, so it is widely used. However, it is most suitable for datasets with a clear unimodal concentration. When the concentration parameter is large, the tail of the distribution decays rapidly, limiting its ability to represent outlier orientations. In contrast, the Bingham distribution provides greater flexibility in representing data with multimodal or elliptical characteristics because it is controlled by asymmetric matrix. However, its application requires complex data processing and large datasets to accurately estimate parameters. For trace length and density estimation in 3D DFNs, Priestet al.proposed different calculation methods to estimate the mean trace length, spatial dimension, and fracture density.
Randomly and discretely distributed fractures in rock masses intersect in 3D space, forming highly complex networks.Although 3D DFN modeling technology has been widely used to visualize the 3D morphology of fractures and provides a basic model for calculating 3D connectivity, different researchers have proposed significantly different parameterization methods. In addition, many studies have ignored the impact of sampling bias on model accuracy, casting doubt on the reliability of the constructed DFN models. Furthermore, current methods for calculating 3D fracture connectivity usually indiscriminately project all fractures within a defined region onto a reference plane. This approach inevitably leads to discrepancies between the calculated connectivity and the actual penetration characteristics of the fracture network observed in the field. Overall, there is still a lack of systematic and effective solutions for characterizing the 3D distribution and connectivity of fractures in deep rock masses.
To address these issues,this study proposes a fracture sampling bias correction method based on the geometric intersection of fracture surfaces and sampling surfaces, thereby constructing a 3D DFN model that better reflects the spatial characteristics of the fracture system. Based on this improved 3D DFN model, the A* algorithm is applied for the first time to identify potential penetrating shear surfaces in 3D space. This method can select key fractures at different elevations, reducing the limitations of traditional projection-based methods。By combining discrete point interpolation with Boolean operations, a new method for calculating 3D fracture connectivity is proposed.The method was applied and validated in the evaluation of low-dip fractures in the abutment rock mass of a hydropower station in Tibet. The method effectively addresses several inherent limitations of traditional connectivity calculations and further expands the application potential of 3D DFN models in shear path identification and quantitative evaluation of fracture connectivity. It provides a new perspective for analyzing the spatial connectivity characteristics of rock mass fractures.
Figures and Tables:

Figure1 Schematic diagram of 2D connectivity calculation method

Figure2 Flowchart of 3D fracture connectivity calculation method

Figure3 Intersection relationship between fractures and measurement window
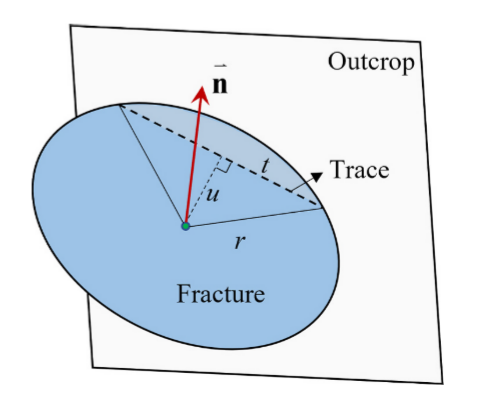
Figure4 Schematic diagram of geometric relationship among disk center, radius, and trace length

Figure5 DFN model generation process: (a) Monte Carlo generation of DFN model; (b) coordinate calculation of deterministic large fractures

Figure6 2D trace generation process of DFN model
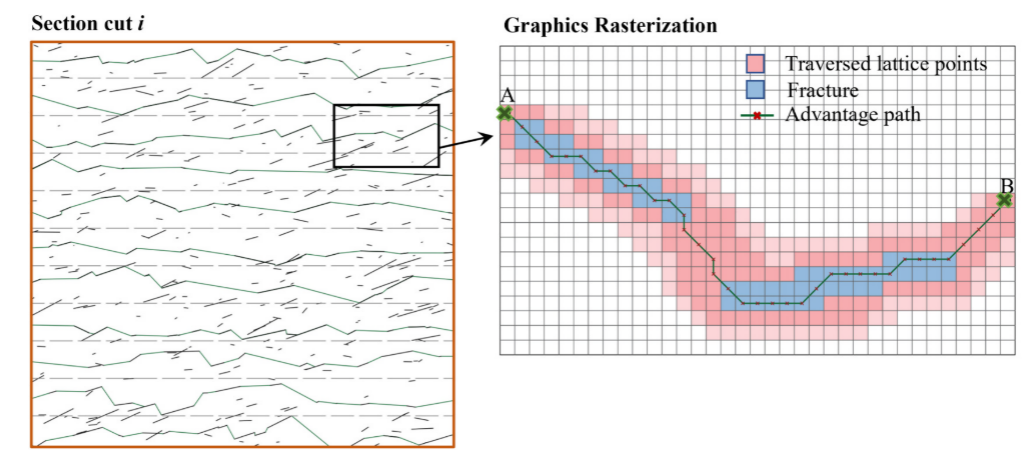
Figure7 Implementation process of A* algorithm for searching potential failure paths

Figure8 3D shear surface generation process: (a) spatial discrete point interpolation analysis; (b) potential 3D shear surface; (c) fracture projection area; (d) remaining area of shear surface

Figure9 Basic characteristics of the study area: (a) geographical location; (b) site photo of right bank abutment
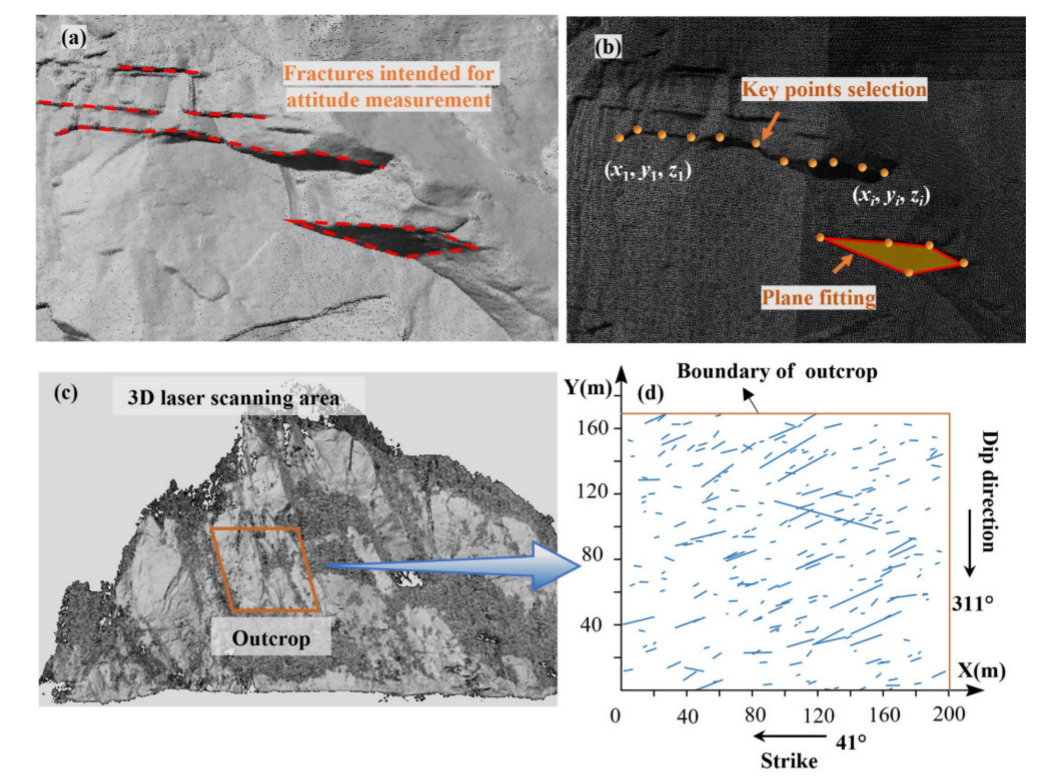
Figure10 Fracture information acquisition process: (a) initial identification of fracture surfaces; (b) point cloud extraction and plane fitting; (c) 3D laser scanning point cloud of slope surface; (d) fracture trace map
Table 1Calculation methods of fracture orientation under special cases


Figure11 Stereographic contour plot of fracture poles (Schmidt net): (a) field measurement results, (b) K-means clustering results, (c) copula simulation results

Figure12 Fracture sampling frequency correction results: (a) scatter plot of corrected frequency versus dip angle; (b) scatter plot of corrected frequency versus dip direction
Table 2 Basic parameters of low-dip fractures in DFN model


Figure13 3D connectivity calculation process of low-angle fractures: (a) 3D DFN model and calculation section; (b) selection and projection calculation of fractures intersecting potential shear surfaces
Table 33D connectivity results of low-angle 3D fractures at different elevations


Figure14 Comparison of traces and orientations between field outcrops and DFN model outcrops

Figure15 Comparison of trace lengths between DFN model and field: (a) Set 1; (b) Set 2; (c) Set 3; (d) Set 4
Table 4 Deviation between DFN model trace lengths and field trace lengths


Figure16 Box plots of shear strength parameters: (a) fracture surfaces; (b) intact rock
Table 5Mechanical parameter values of rock bridges and fractures


Figure17 Numerical model and test loading method: (a) numerical model; (b) loading method

Figure18 Axial stress-strain curves under different confining pressures and Mohr-Coulomb strength envelopes: (a) axial stress-strain curves under different confining pressures; (b) Mohr-Coulomb strength envelope
Figure19 Trace map of low-dip fractures in the right bank abutment tunnel (partial view)

Figure20 2D connectivity calculation results of low-dip fractures in the tunnel: (a) 2D connectivity calculation results under different bandwidths; (b) comparison of 2D and 3D connectivity calculation results

Figure21 Directional sensitivity analysis of fracture connectivity:(a) Schematic diagram of slice directions. (b) Rose diagram of connectivity under different sheardirections
Table 6Connectivity and stability calculation results under different shear directions


Figure22 Relationship between connectivity and stability factor
Conclusions:
The spatial connectivity characteristics of fractures in rock masses were studied, and a new method for calculating 3D fracture connectivity was proposed.The main contributions of this study are summarized as follows:
(1) A fracture sampling frequency correction model based on the intersection probability of fractures and outcrop surfaces was proposed, providing reliable data for subsequent 3D connectivity calculations.
(2) A joint bivariate distribution function was introduced to represent the correlation between fracture strike and dip angle, overcoming the limitation of traditional methods that treat these parameters separately.
(3) Using statistical modeling parameters and corrected fracture frequencies, a more accurate 3D DFN model containing deterministic large-scale fractures and outcrops was established.The A* algorithm combined with discrete point interpolation analysis was used to predict potential 3D shear surfaces, and Boolean operations were used for 3D projection to calculate fractures involved in potential failure paths, thereby producing a more accurate 3D connectivity calculation method.
(4) The method was combined with traditional 2D calculation methods to evaluate the connectivity of low-dip fractures in the abutment rock mass of a hydropower station in Tibet.The connectivity results were 37.3% and 47.6%, respectively. Compared with the value obtained by mechanical back analysis (32.5%), the deviation of this method was only 4.8%, showing higher accuracy.
(5) The 3D connectivity calculation method is directionally sensitive, and connectivity increases with the increase of the angle between the shear direction and the slope strike.This behavior is influenced by the orientation of major fractures in the slope and highlights the importance of selecting the shear direction not only based on geometry but also based on the in-situ stress conditions of the rock mass.
References
[1] Liang P, Wei Y, Guo H, et al. 3D connectivity calculation method for low-dip fractures in high-steep rock slopes[J]. Engineering Geology, 2025, 355: 108227.
Company News | XCMG: A Guardian of the Longmen Grottoes
下一篇People Spotlight | Yang Yuli: A Heart of Bedrock, Witnessed by Rivers

2026-09-28 1157 0
2026-09-24 10586 0
2026-09-23 10714 0
2026-09-22 10808 0

Lize City Air Terminal Underground Main Structure Nearing Completion: Maximum Transfer Walk Under 4 Minutes After Operation

Anti-seepage Curtain for Main Lock Pit of CSCEC Port Shenqiu Double-Line Lock Project Completed on Schedule

All Pile Foundations Completed on Quanzhou Baiqi Channel

Hainan Upgrades Housing and Municipal Infrastructure
First Foundation Concrete Pour Successfully Completed for Zambia Kafue West–Muzuma 330kV Transmission Line EPC Project
Hot News

评论 (0)