
Abstract
This paper summarizes the analytical model and experimental research results of a tandem anchor composed of two drag embedment anchors. Drag embedment tests were conducted using a tandem anchor with an anchor spacing of 5.4 times the anchor plate length, and the experimental results validated the established analytical model. The research shows that: (1) the calibrated tandem anchor prediction model can effectively predict the ultimate bearing capacity, movement trajectory, and pitch angle of the front and rear anchors in the tandem anchor; (2) the total ultimate bearing capacity of the tandem drag embedment anchor may exceed twice the bearing capacity of a single anchor, because the tandem arrangement causes the front anchor to mobilize greater rotational resistance when constrained than when it rotates freely as a single anchor. Tandem Drag Embedment Anchor Connecting two drag embedment anchors in series, commonly known as a tandem anchor, can utilize existing equipment to enhance anchoring bearing capacity. Figure 1. Schematic diagram of tandem drag embedment anchor and its penetration trajectory Simplified Analytical Model for Tandem Drag Embedment Anchor 01 Single Anchor Drag Model This study adopts the simplified single anchor drag model proposed by Aubeny and Chi, which is suitable for drag embedment behavior in clay. Figure 2. Schematic diagram of the geometry of a single anchor The drag load can be simplified into three components: the force component H along the anchor plate surface, the force component V perpendicular to the anchor plate surface, and the bending moment M relative to a reference point (such as the anchor plate centerline). Under the combined action of these three loads, the anchor will fail and undergo translational displacement along the anchor plate direction (δh), vertical displacement perpendicular to the anchor plate direction (δv), and rotation about the reference point (δβ). Aubeny and Chi proposed a mathematical expression to describe the yield surface of the anchor under combined loading: Npmax: normal bearing capacity coefficient under pure normal loading; Ntmax: in-plane shear bearing capacity coefficient under pure in-plane shear loading; Nmmax: rotational bearing capacity coefficient under pure rotational loading; m, n, p, q: interaction coefficients used to determine the shape of the yield surface. The simplified drag model assumes that the anchor quickly reaches an equilibrium state during drag embedment, at which the anchor line tension is proportional to the undrained shear strength of the soil and the anchor plate area, characterized by the equilibrium bearing capacity coefficient Ne (see Figure 2). Where su is the undrained shear strength of clay, and Af is the anchor plate area. The differential displacement ratio of the anchor in the normal and tangential directions of the anchor plate surface (Rnt in Figure 2) and the relative motion ratio of rotation to parallel movement along the anchor plate (Rrt in Figure 2) are assumed to be constant in this equilibrium state. These model input parameters Ne and Rrt can be related to the yield surface in Equation (1). The parameter Ne represents the distance from the current state point to the yield surface when the combined load (V, H, M) causes anchor failure, while Rnt and Rrt represent the tangential slopes of this point on the V−H plane and M−H plane, respectively (Figure 3). Figure 3. Examples of different Ne, Rnt, and Rrt values on the yield surface for different interaction coefficients (m, n, p, and q): (a) Ne, Rnt; (b) Rrt and yield surface interaction coefficients n and q The input variables Ne, Rnt, and Rrt are most sensitive to the yield surface interaction coefficients m, n, and q (Equation 1); therefore, these coefficients can be estimated from the measured anchor penetration trajectory and load during drag tests (Figure 4). Figure 4. Examples of drag embedment prediction results: (a) bearing capacity under different Ne values; (b) penetration trajectory under different Rnt values The angle θa between the anchor line at the anchor eye and the horizontal direction (Figure 2) is calculated using the simplified anchor-anchor line interaction model proposed by Neubecker and Randolph (1995). This model, based on the bearing resistance and shear resistance provided by the soil to the anchor line, establishes a functional relationship between the anchor line tension at the anchor eye and the anchor line tension at the mudline. The anchor movement trajectory and the anchor line tension at the mudline are solved by a recursive method. By establishing the force equilibrium and moment equilibrium equations of the anchor, the tangential displacement of the anchor is advanced step by step with an increment of dt=Δt. The specific implementation steps of this recursive algorithm are as follows: 1. Set the initial embedment depth of the anchor. 2. Calculate the tension at the anchor eye based on Equation (5). 3. Check the initial inclination angle of the anchor line at the anchor eye using Equation (8), and solve for the anchor plate rotation angle using Equation (9).


Enterprise News | China Water Conservancy Standards AI Large Model Officially Released
下一篇Enterprise News | From Lateral Clamping to Tapered Self-Locking — The Innovation Path of Zhaodi Holding Group's Fully Prefabricated Construction Connection Technology

2026-10-18 0 0

2026-10-18 0 0

2026-10-17 0 0

2026-09-23 10598 0
Lize City Air Terminal Underground Main Structure Nearing Completion: Maximum Transfer Walk Under 4 Minutes After Operation
Anti-seepage Curtain for Main Lock Pit of CSCEC Port Shenqiu Double-Line Lock Project Completed on Schedule
All Pile Foundations Completed on Quanzhou Baiqi Channel

Hainan Upgrades Housing and Municipal Infrastructure
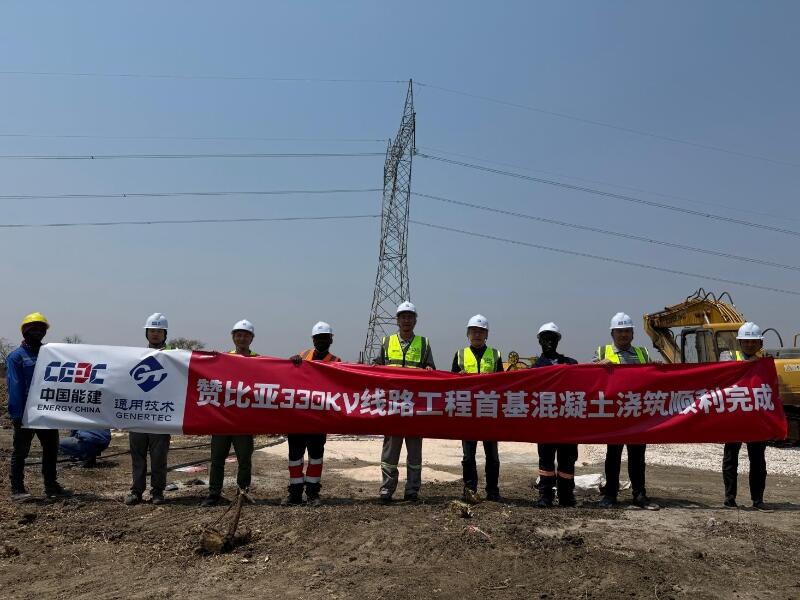
First Foundation Concrete Pour Successfully Completed for Zambia Kafue West–Muzuma 330kV Transmission Line EPC Project
Hot News

评论 (0)